In this section we will shift away from the psychological and theoretical models of mortality salience and instead examine results recently generated in the lab, using functional magnetic resonance imaging (fMRI). We will examine both results that have been published from my lab and new, previously unpublished results.
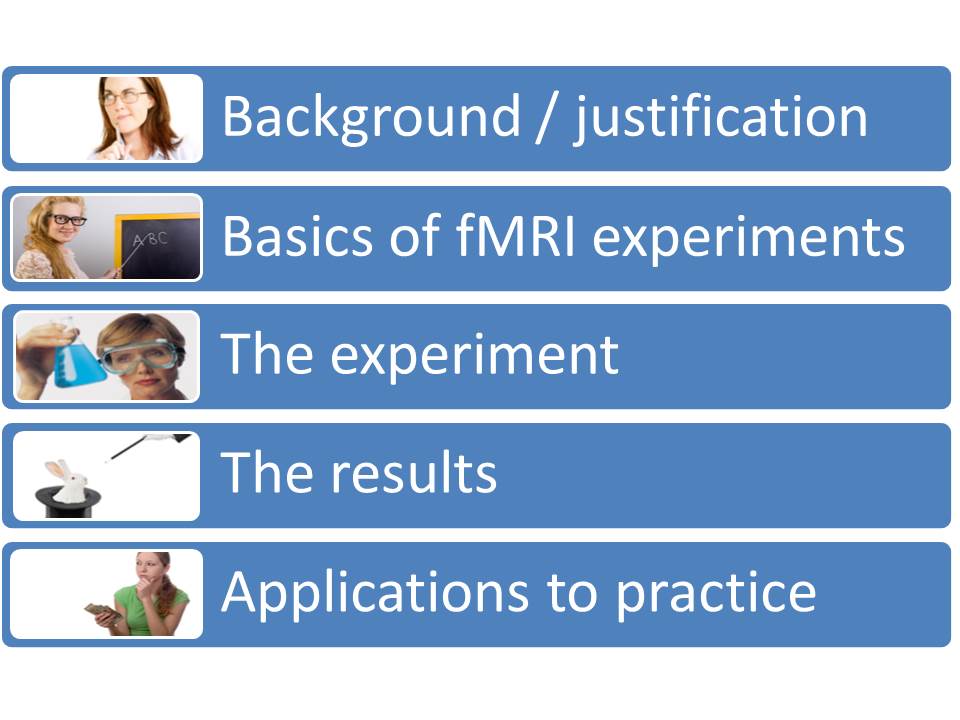
In this examination of what neuroimaging can tell us about charitable bequest decision-making, we will look at five different areas. First, we will look at justification for why the topic is worth exploring and why neuroimaging may be useful in improving our understanding of these decision making process. We will also review what has already been done in previous neuroimaging research on related topics.
Next, we will look at the basics of functional magnetic resonance imaging experiments. Although it is common practice in popular literature to skip over the realities of fMRI experiments, without this basic understanding it is easy to completely misinterpret reported results. Next, we will examine the experiments that were conducted in our lab, including all of the details about the presentations of the questions and the analysis conducted, excluding only the technical issues related to statistical analysis and image acquisition. Next, we will look at the results of these experiments. And then finally, we will shift to considering the applications of these results to the real world practice of charitable bequest fund raising.
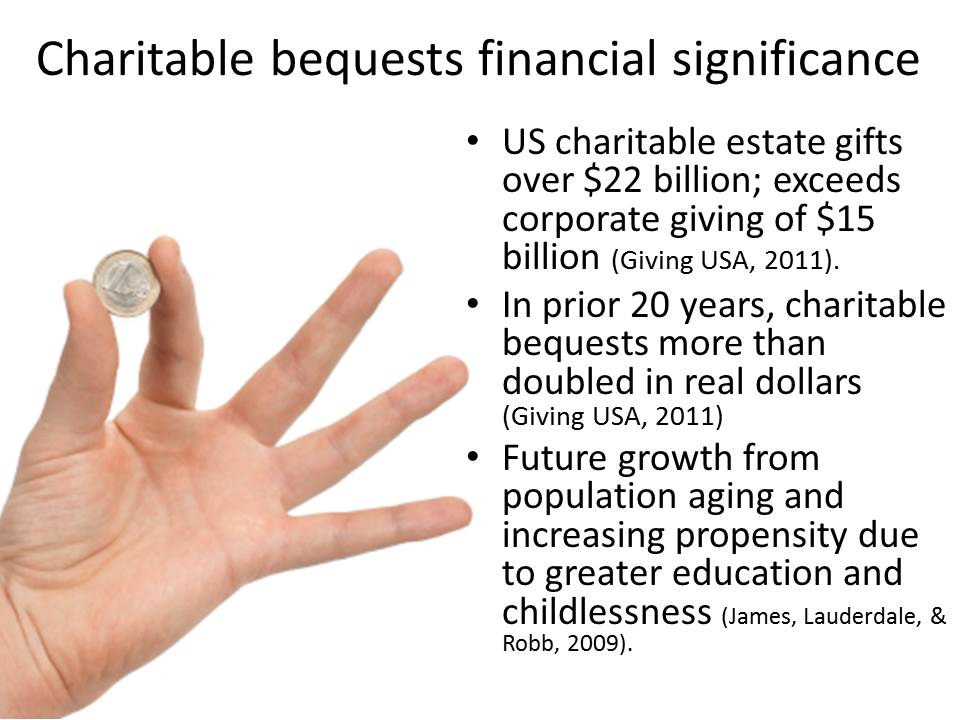
It is certainly the case that gaining a deeper understanding of bequest giving is an important goal, if only from a strictly financial perspective. Recent reports showed estate giving exceeding $22 billion annually in the United States. In comparison, this was a larger amount than all corporate giving combine.
Not only is this amount large, but it will, by all projections, continue to increase substantially over the coming years. In the last 20 years charitable bequests have more than doubled in real dollars. The next 20 to 40 years has the potential for continued dramatic increases due both to the increasing population of the older age groups, and to the increasing propensity to engage in charitable bequest planning among those in these age groups. Two of the strongest indicators for having a charitable estate plan are education levels and childlessness. Because we are able to project both the future education levels and the future childlessness rates among the age ranges that generate the bulk of all charitable estate transfers (primarily, those in their 80s and beyond), we can feel fairly confident that the propensity to leave charitable bequests will be increasing among this population, which itself will be increasing in absolute size both in the United States and in Western Europe.

Along with these already encouraging demographics, there is additional potential for even more dramatic growth in charitable bequest giving. This, of course, relates to the dramatic behavioral gap between current giving and bequest giving. To the extent that an increased understanding of bequest giving may help to close some small part of this massive gap, we could see phenomenally greater increases in charitable estate transfers in the coming years.
As discussed previously, bequest giving is an area in which traditional trial and error methodologies, which may be effective for current giving, are of limited value. Consequently, alternative methodologies for understanding the charitable bequest decision-making processes are particularly important in this area. We are, in a sense, forced to go more deeply into an understanding of the underlying neurological and psychological mechanisms, because we cannot conduct the type of quick and easy financial experiments that are possible in the field of current giving.
If, as in current giving, we could quickly experiment with different strategies and approaches, and quickly see immediate financial differences, it might be less important that we have a substantive understanding of the reasons why different strategies do and do not work. In current giving, we can see knowledge repeatedly tested, either confirming or denying our expectations, because of a continuous inflow of short-term results.
In charitable bequest giving there are almost no short-term financial results. Indeed, the time for complete results is so long as to often exceed the typical tenure of a fund-raising practitioner at a particular institution. Thus, in the area of bequest giving it is much more critical that we have accurate and scientific theoretical constructs supporting why we do what we do in fundraising practice. This need for scientifically supported theoretical constructs leads us to the current examination, attempting to explore the neurological characteristics of charitable bequest decision-making.
Although there have been no prior neuroimaging studies on the topic of charitable bequest decision-making, there have been a handful of previous studies on the topic of charitable giving. In the first neuroimaging paper on this topic Jorge Moll and colleagues found that charitable giving engaged regions referred to as mesolimbic reward systems in a way that was similar to what occurred when subjects received monetary awards. William Harbaugh and others found that giving generated neural activity in reward processing areas, specifically the ventral striatum.
It is important to note that such results are subject to more than one interpretation. Although the regions activated are also activated as reward areas, this is not the only stimulus that causes a reaction in these areas. It is perhaps more accurate to describe these areas as being sensitive to salience (or in a non-technical sense as responding to anything that grabs our attention and focus). Thus, for example, these same areas were engaged in Harbaugh’s experiment when people lost money due to forced “taxation” transfers to charities. However, we wouldn’t be likely to interpret a taxation experience as a reward experience. It seems that a much more plausible account of these results is that taxation grabs our attention, and that it is this salience which is being observed in the neural activations reacting to forced taxation. Thus, there is at least a conjecture that the practice of making a charitable gift creates a reward in the mental structures in the brain, but that there are alternative interpretations for this activation.
This type of challenge is quite common in the field of neuroimaging. The brain is complex and, consequently, the same region or regions may be engaged for a variety of different reasons and for a variety of different purposes. As such, it is particularly helpful in this field to engage in what I like to call “triangulation.” That is, we like to see results that fit not only with other neuroimaging results but also with results from other methodologies, including quantitative and qualitative social science research. Although neuroimaging can be quite helpful in improving our understanding of a process, it is only one piece of the puzzle.
One consistent result across several neuroimaging studies of charitable giving is that charitable giving engages brain regions that are used in social cognition. In other words, neurologically, charitable giving is a social act.
This was cleverly demonstrated by Keise Izuma and colleagues in their 2009 study in which participants made a series of decisions related to making charitable gifts out of the money being paid to the participants for their involvement in the study. The screen which presented these choices also showed a video camera image of the research assistants who were observing the participants making these decisions. The research assistants were present for some of the decisions, but for some sets of the decisions, they left so that the participants saw only their empty chairs alongside the charitable giving decision choices. The researchers found that there was greater activation in the reward/salience areas, specifically the ventral striatum, when observers were present to watch the charitable decisions. This helps to confirm the social nature of charitable giving decisions. This reward difference occurred even though the observers had no relationship with either the participants or the recipient charities.
Both Todd Hare, et al. (2010) and Jorge Moll, et al. (2006), found evidence of activation in brain regions associated with social cognition, social attachment, and social aversion. However, beyond these handful of studies we know relatively little about the neurological processes involved with charitable decision-making for current gifts, and we know essentially nothing about the neurological processes involved with bequest decision-making.
Next we will take some time to review the basics of fMRI experiments. Again, such a review is important to understanding the real significance of neuroimaging results. Such results are often reported in an overly simplistic and misleading way in the popular press. To avoid this, we will take the time to walk through the core concepts necessary to intuitively understand what fMRI experiments are actually measuring.
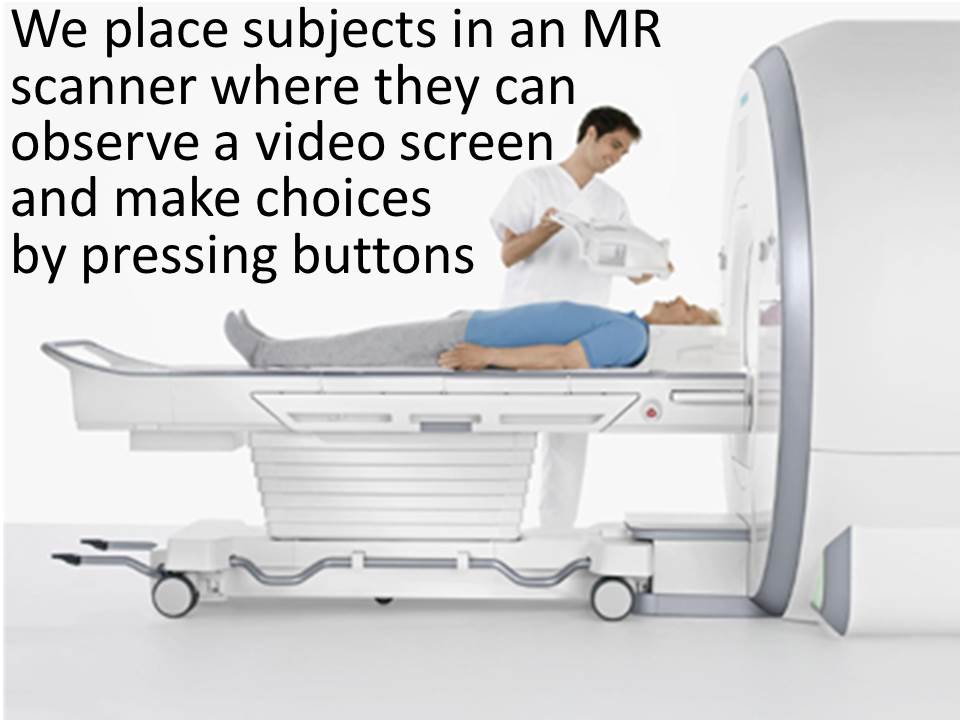
To begin with, we placed subjects in a magnetic resonance imaging scanner. As you see in the above image, people are lying on their backs and looking straight up. The lab technician places the helmet like device seen in the above image, over the participant’s head, and the moving table slides the participant’s upper body into the imaging machine. Participants can see a mirror which reflects a computer screen projection. Thus, participants can view any stimuli which can be placed onto a computer screen. In addition, participants have response buttons in both hands, allowing them to make choices and selections among the different options shown on the computer screen.
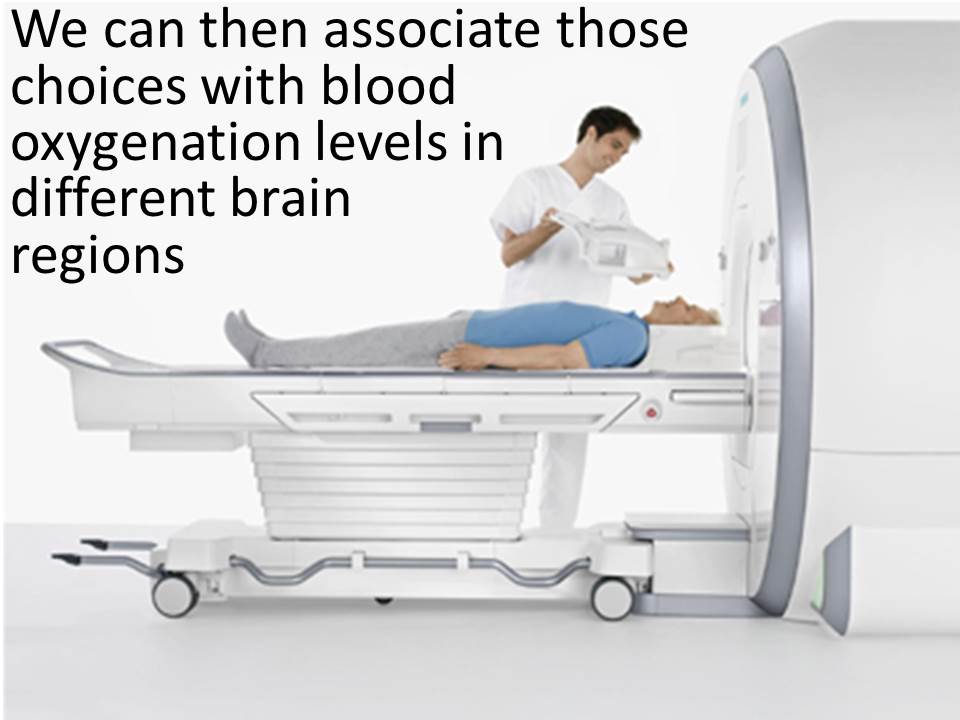
As participants look at the various computer screens and make choices using the buttons on each hand, we can observe the differences in blood flow in different regions of the brain, thus allowing us to infer which regions of the brain are particularly engaged with the different types of decisions.
In this case, the first-stage defense of avoidance is not an available option. The bequest-related questions are asked directly to the participants and no participants refused to answer this block of questions. Consequently, we do not explore the neural correlates of avoidance, but instead explore the neural correlates of active bequest decision-making.
All of this may seem to be a rather weird environment in which to make decisions or study decision-making. It is obviously not the normal, natural context in which these decisions are made. Nevertheless, as abnormal as this circumstance may initially seem, participants quickly acclimate to the environment. Before answering our questions, they have spent a substantial amount of time in the scanner, being in the environment, and even working with the buttons to familiarize themselves with the processes. (For those familiar with the processes we conduct the anatomical scan prior to any functional scans, thus allowing the participants time to acclimate to the environment.)

And now we will review some of the conceptual details of neuroimaging. However, recognizing that the readers of this text have no interest in changing their careers to pursue neuroimaging, the following is an attempt to provide a simplified story that conveys the central, critical characteristics of neuroimaging research, using a character I like to call “Vickie Voxel.”
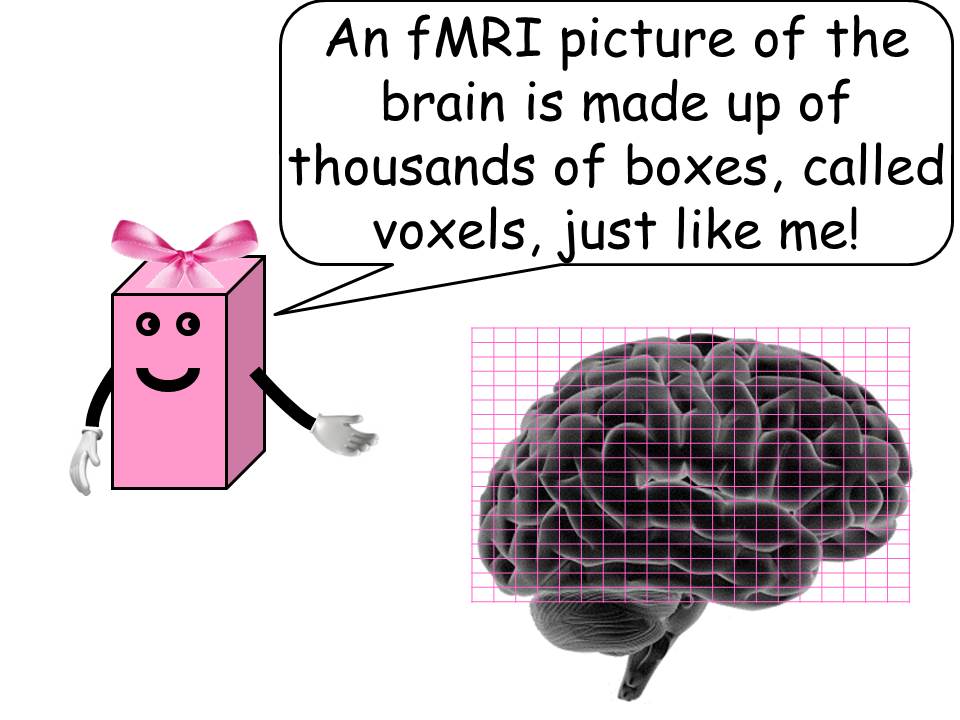
We begin with the simple idea that an fMRI picture of the brain is made up of thousands of boxes, called voxels. You may be familiar with the term pixel from a computer screen in which images are made up of individual dots called pixels. Neuro-images are also made up of these dots. However, neuro-images are three dimensional. Thus, the dots actually have volume, and are therefore called voxels, as the term “voxel” is short for “volumetric pixel.”
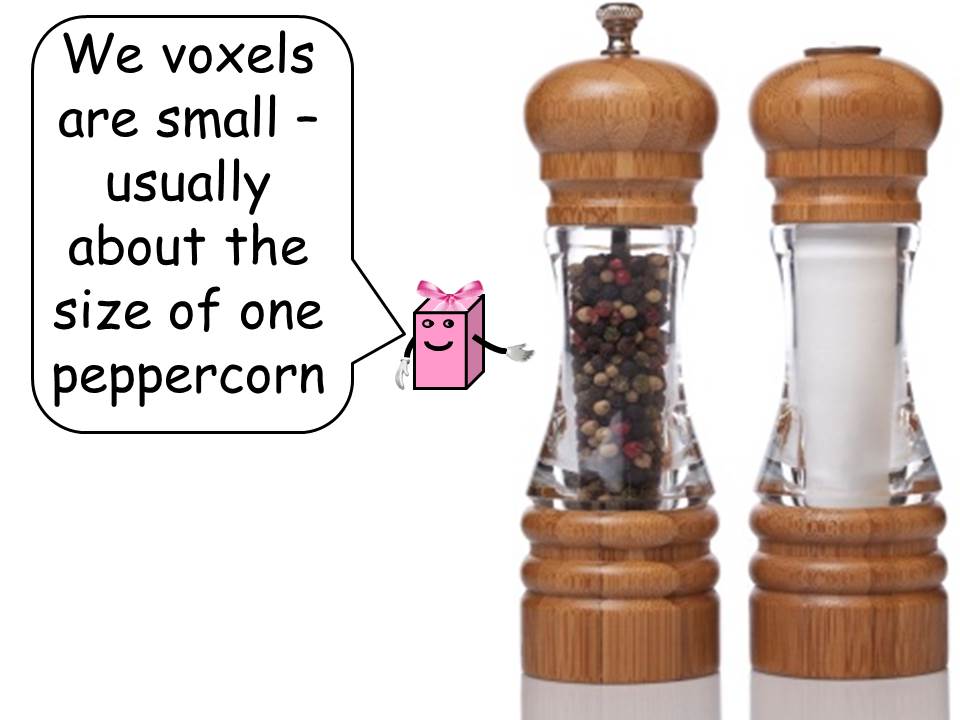
In current neuroimaging technology these voxels are relatively small, usually about the size of one peppercorn. In our neuroimaging experiments, we used voxels that were 2x2x2 millimeters in size. Although it is possible to use smaller voxel sizes, this increases the amount of time each scan through the brain takes and consequently there are trade-offs in the quality of data obtained. At this level of resolution, we were able to take complete scans of the brain every three seconds.
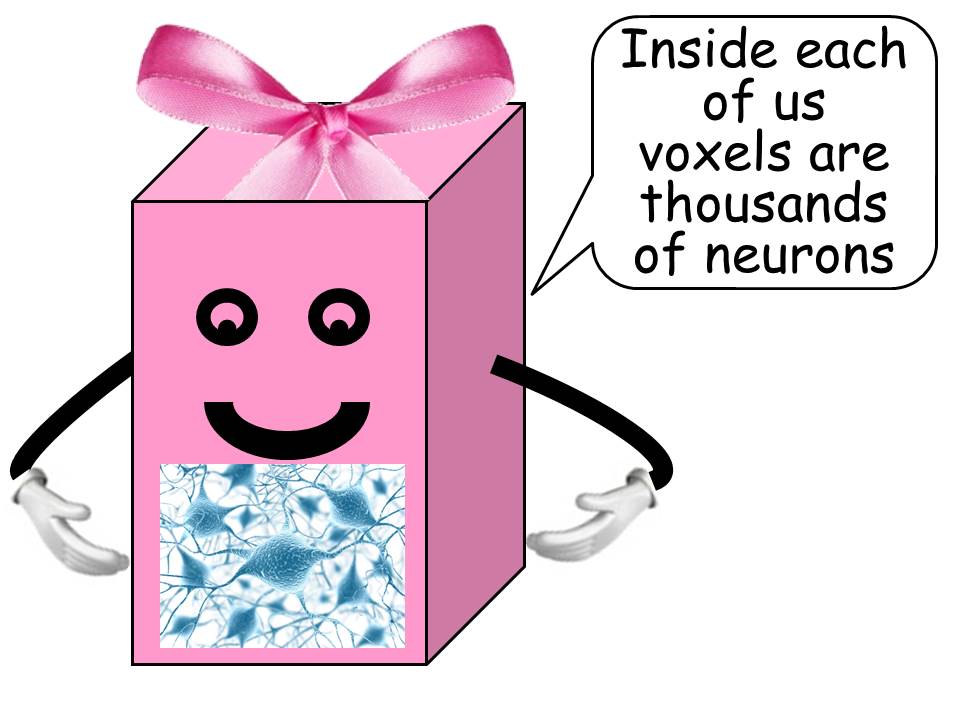
Although a voxel size of 2x2x2 millimeters may seem to be a very small area of analysis, each voxel contains thousands and thousands of individual neurons. Thus, the technology is such that we are able to observe only large areas of simultaneous activation rather than individual neuron firings.
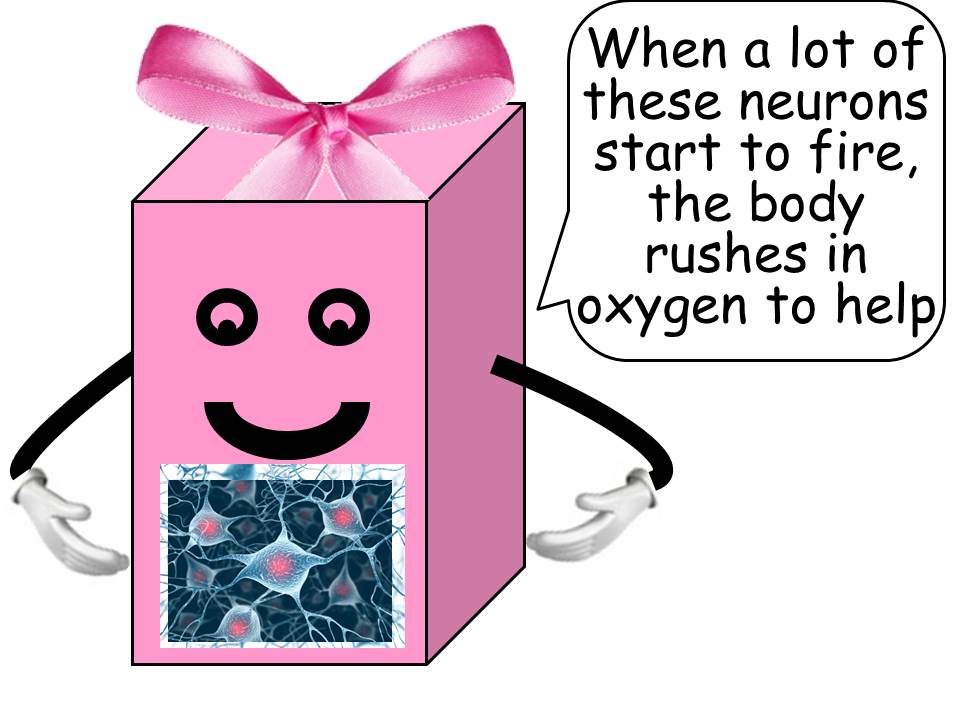
Although we cannot see individual neurons fire, we can see when a large group of neurons fires in the same area. The mechanism by which we are able to identify the firing of neurons within a voxel is by observing changes in blood oxygenation. We observe these changes because as many neurons begin to fire, the body reacts to this firing by rushing oxygen to the region to help the neurons replace the oxygen used during firing.
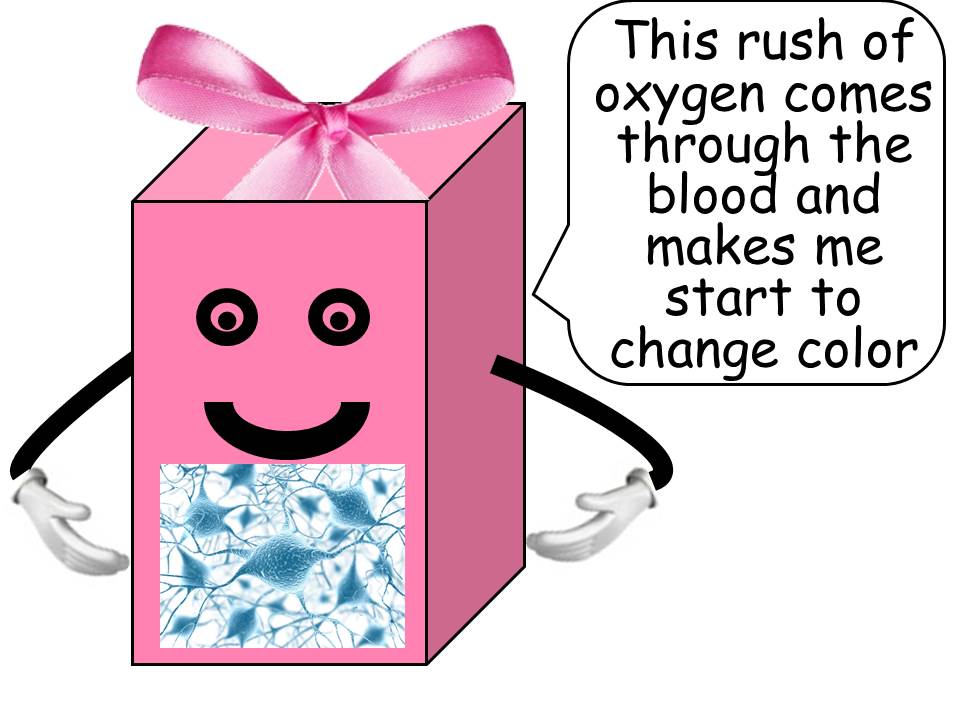
It is this rush of oxygen to the region that causes changes within the voxel region. Specifically, the voxel begins to change color.
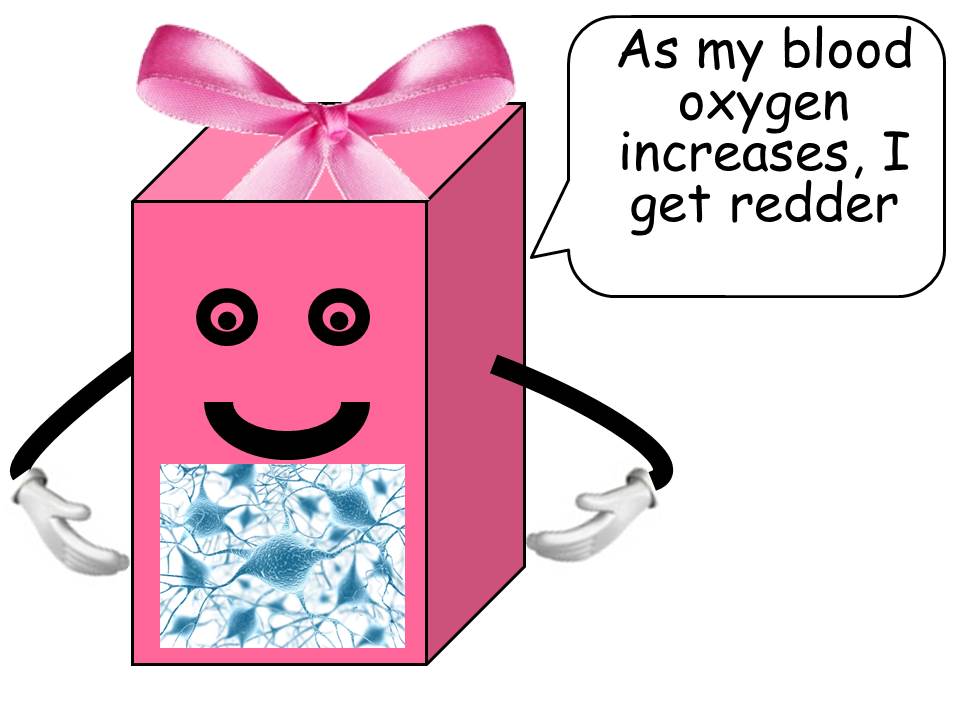
The voxel becomes redder due to increased oxygenation of the blood in that region.
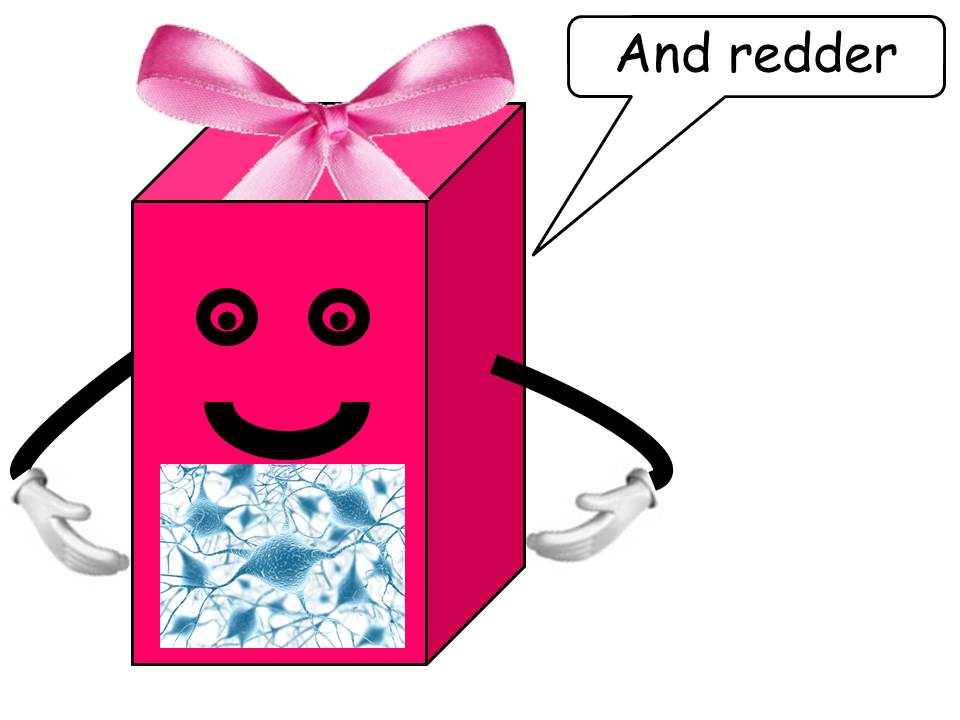
This increased oxygenation does not happen instantly, but takes place over several seconds as the voxel region gradually becomes more and more heavily oxygenated and consequently becomes more red.
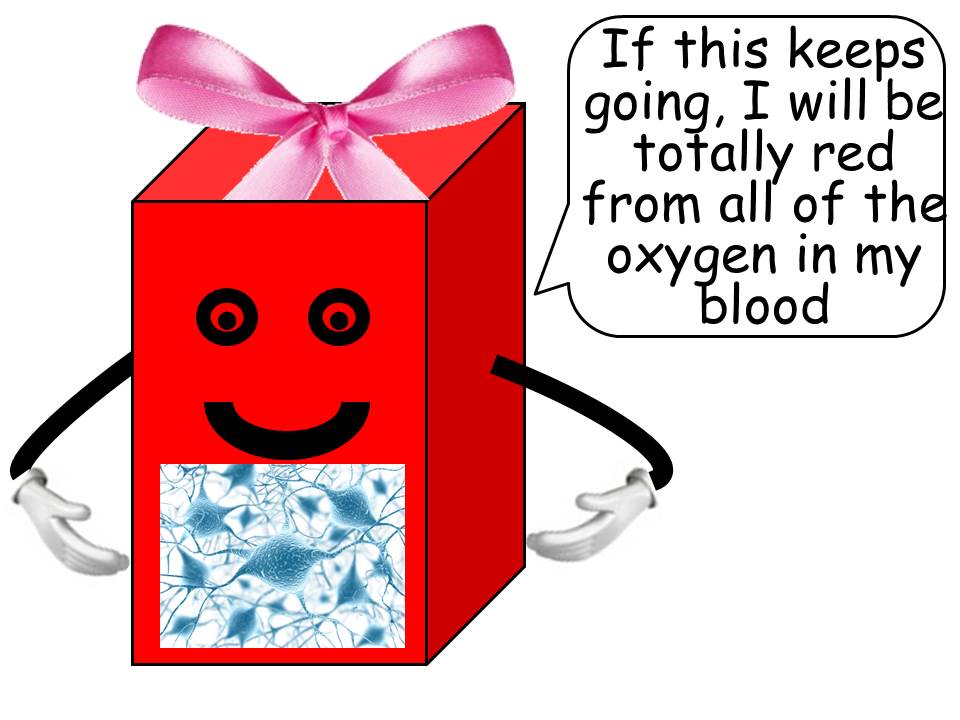
And so, while it is not accurate to refer to areas of the brain that “light up,” it is accurate to refer to regions of the brain that turn more red as the result of oxygenation. It is this change in oxygenation that we observe in the fMRI machine.
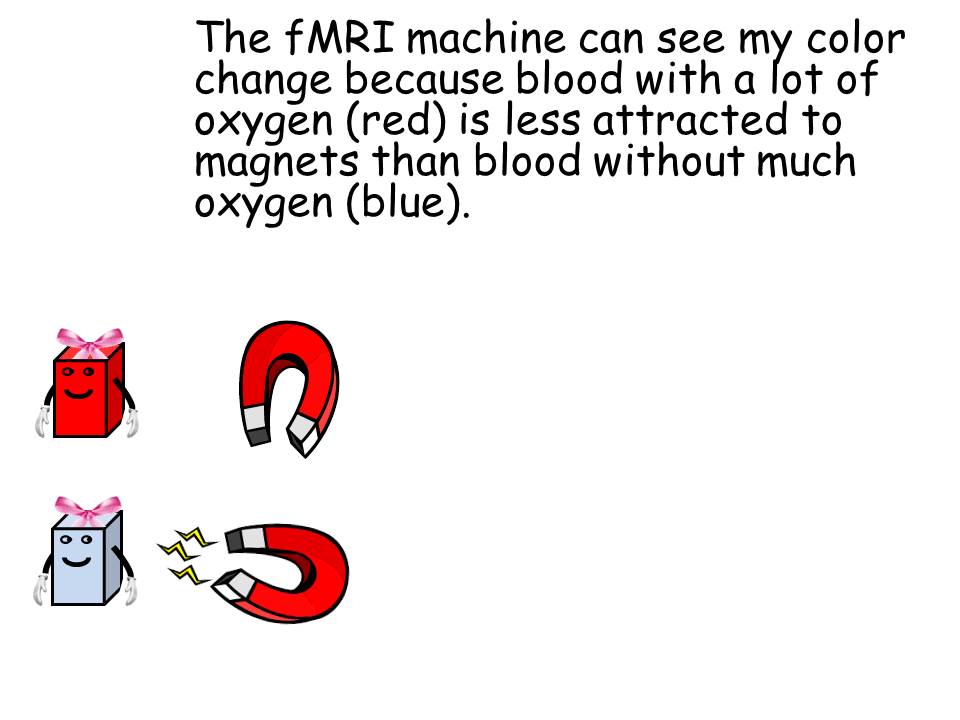
The fMRI machine can see this color change because oxygenated blood (which is more red) is less attracted to magnets, than deoxygenated blood (which is more blue). The oxygen essentially covers the iron molecules within the blood, causing it to be less attracted to magnets. It is this difference in the para-magnetism of the tissue that an fMRI machine can observe and record.
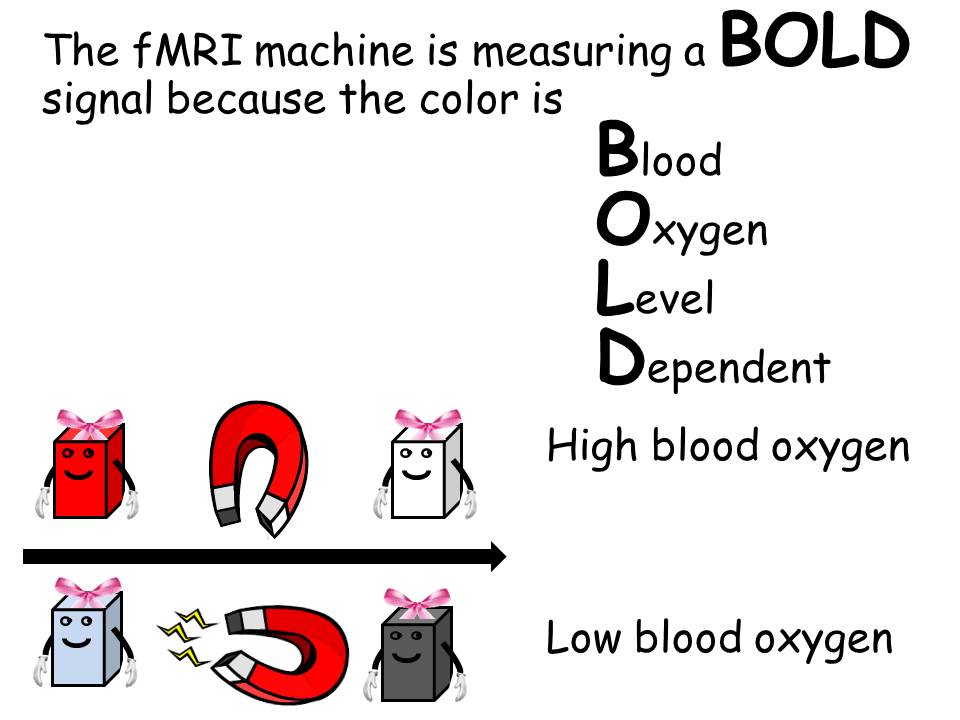
The signal measured by the fMRI machine is referred to as a BOLD signal, because it is Blood Oxygen Level Dependent. As blood oxygen increases, the attraction to magnetism decreases. As blood oxygen decreases, the attraction to magnetism increases.
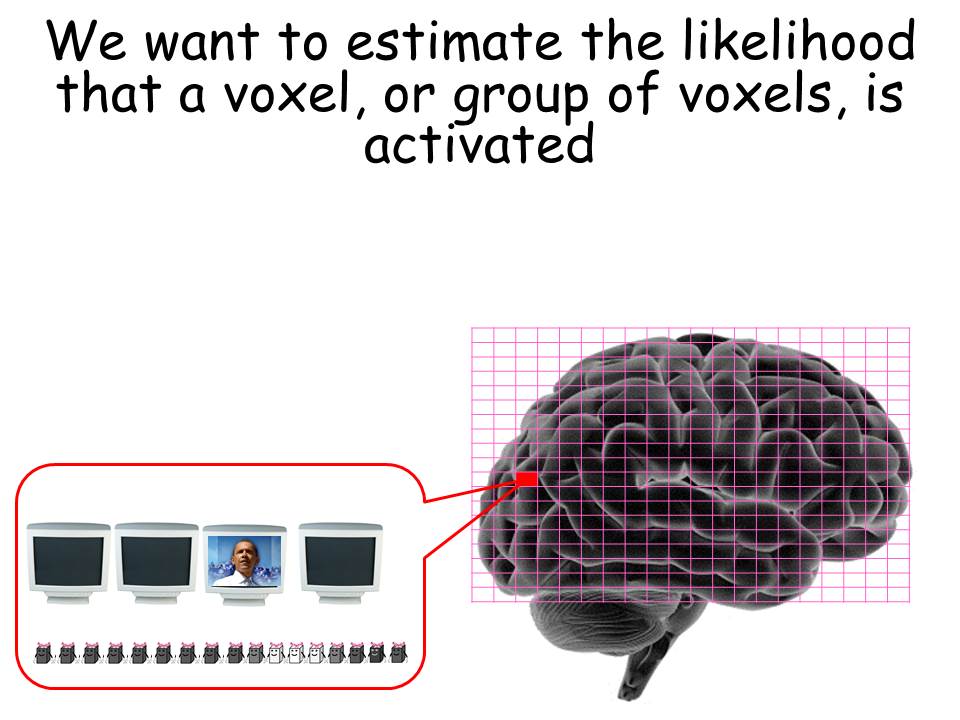
We use this BOLD signal to estimate the likelihood that a voxel or group of voxels is activated in response to some stimulus.
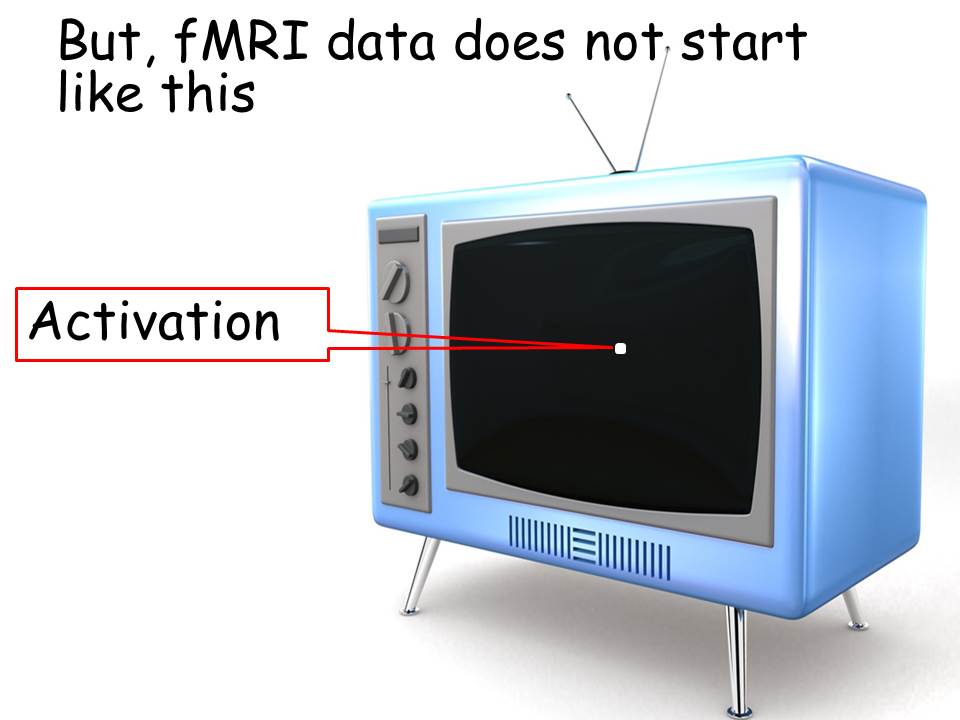
But, fMRI data does not begin in a simple form showing clear activations.
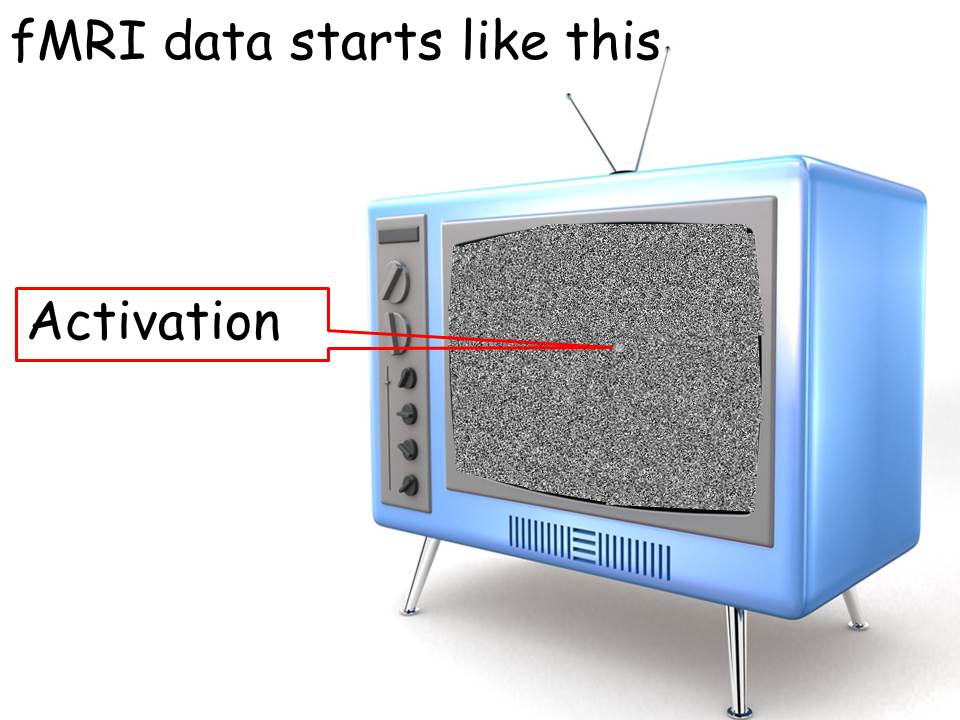
Instead, fMRI data starts out like the snow on a black-and-white television screen. It contains the signal we are interested in, but it also contains a lot of other signals that we are not interested in.
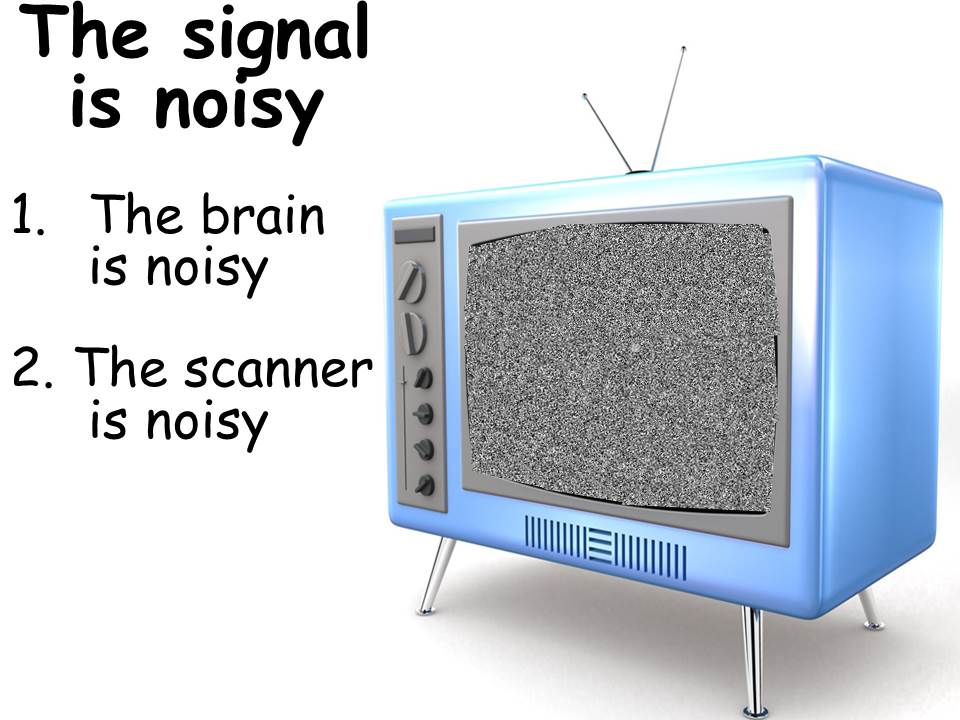
The reasons for this noisy signal are that the brain is noisy and the scanner itself is noisy.
First, the brain is noisy. What we mean by saying that the brain is noisy is that the brain is constantly active, constantly firing, constantly receiving input, and constantly sending instructions. Although this represents real neural activations, these are not activations that we are particularly interested in. If we simply asked what regions of the brain are active when a person engages in task “X”, the real answer may very well be that all regions of the brain are active. The brain is a great multi-tasker. It regulates heartbeat, blood flow, movement, vision, and body temperature. It does many, many, many things simultaneously. And the cognitive process that we may be interested in is only one of the large number of processes that the brain may be engaged in at any one point in time.
But it is not simply a matter of separating cognitive processes from other neurological processes. It is in fact the case that conscious thought itself is scattered. Even when we are trying to concentrate on something, it is a challenge to maintain that narrow focus.

So given that our brains are noisy, how do we design experiments that will give us meaningful results rather than just a pile of brain noise? We do this by employing two simultaneous strategies. The first strategy is to think in contrasts and the second is to use repetition.

Fundamentally, the most important concept to understand about neuroimaging data is that all neuroimaging results demonstrate a contrast between two or more situations. It is not fundamentally meaningful to ask, “what happens in the brain when a person is doing task X”, because of the simultaneous, multi-dimensional activity of the brain. Rather, it is meaningful to ask only “what happens in the brain when a person is doing task X AS COMPARED WITH task Y”.
This is a core characteristic of neuroimaging results that is often excluded from popular press reports. We deal with the constant unrelated activity in the brain by comparing what takes place during one kind of activity with what takes place during another kind of activity. By doing so, we are able to cancel out the normal activation that occurs in the brain in both conditions.
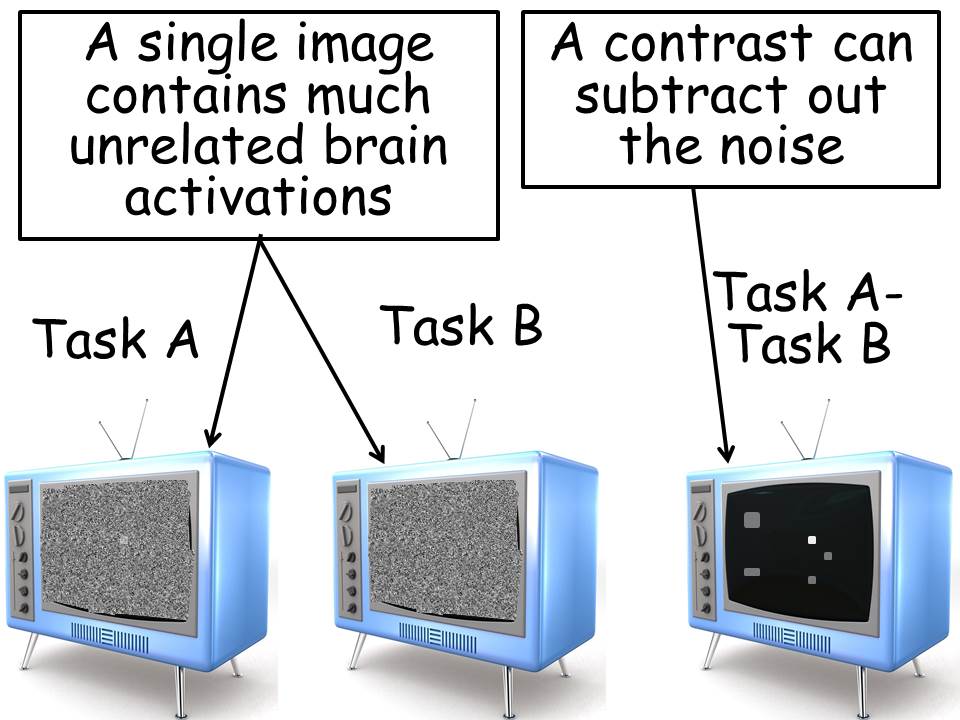
Visually, we can think about the problem in terms of an old “black-and-white” television image. If we were to look at an image of neural activation during a task, we would see the equivalent of a screen filled with white noise or “snow”. When we looked at the image of a related task, we would also see an image of “snow.” However, if we subtracted the second image from the first, we would, by that process, subtract out the noise and retain the activations that uniquely differentiated the first task from the second.
It is by this process that we are able to generate brain images that show activation in only a small number of regions. However, we must never forget that these brain images are not the result of neural activations during task a but are instead the result of subtracting the neural activations in one task from the neural activations in another task.
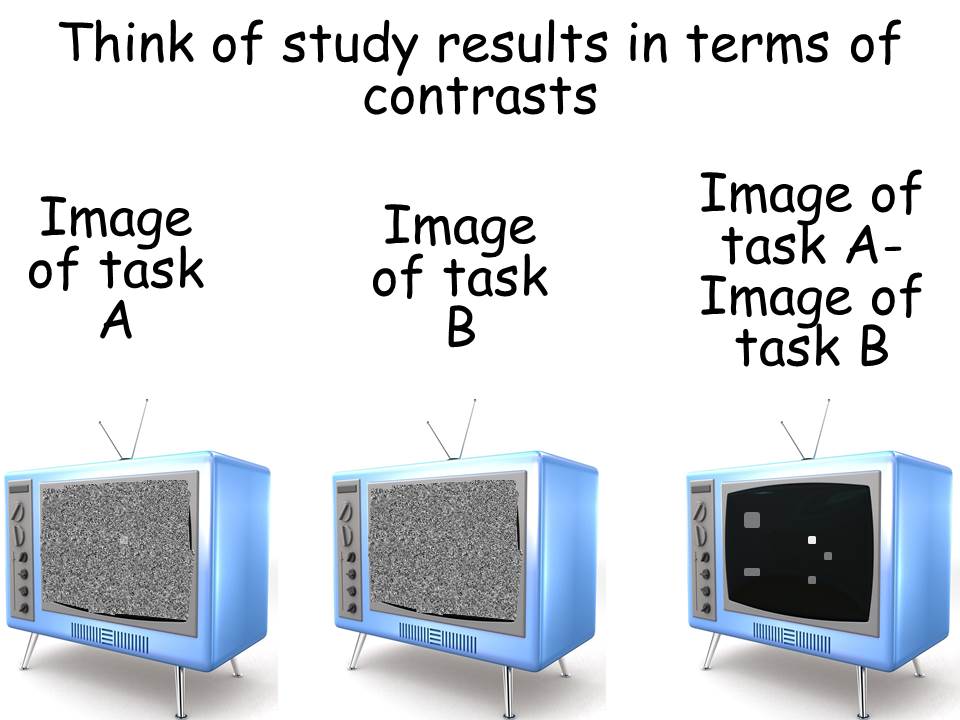
So when we read any neuroimaging results, in the popular press or otherwise, we must always think of those results in terms of contrasts comparing one activity to another.
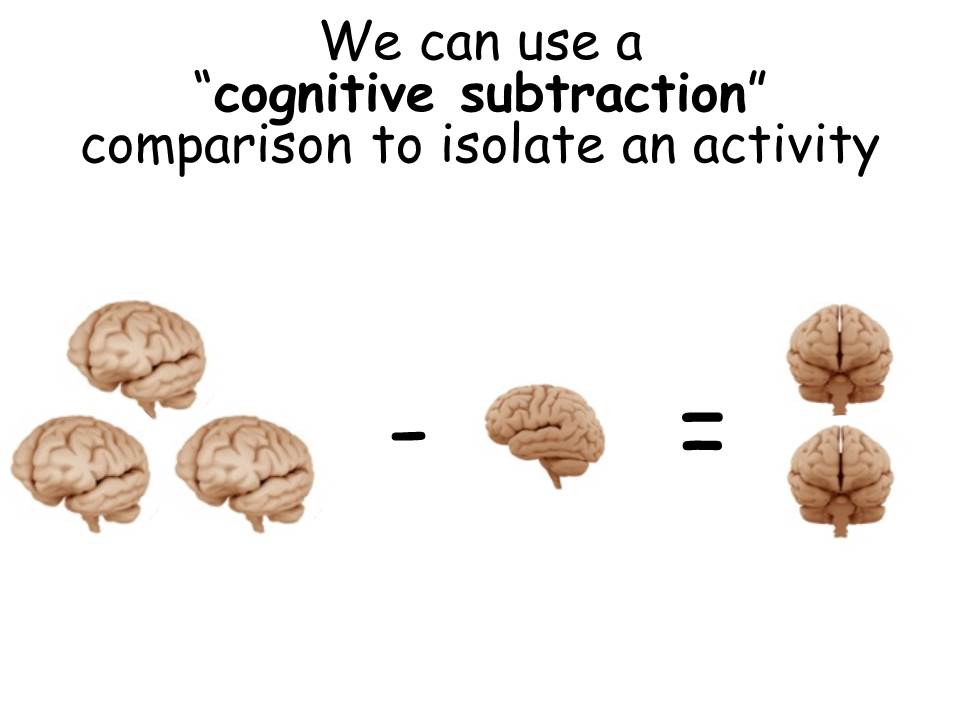
Understanding this, we then attempt to design experiments that isolate our key characteristic of interest by comparing with similar tasks that are different in small, but important, ways.
Ideally, we want to create an experimental paradigm where the comparison task is identical to the control task except for one variation of particular interest. The reason we want to create experiments like this is so that when we contrast (subtract) the images from the experimental condition and the control condition, those differences will be uniquely associated with that single variation of interest. In that way, we can more precisely understand exactly what the neuroimaging results are measuring.
The problem is that if we compare two situations which differ in many different ways, then we won’t know which of these differences were related to the change in neural activation. We will only know that one of the many differences between the two conditions, or perhaps some combination of them, was responsible for the difference in neural activation. Unfortunately, this means we will have less understanding of exactly what stimulus difference generated the observed changes. Perhaps more critically is to understand that all neuroimaging data is comparison data. We do not want to make the mistake of saying, for example, “This is what happens in the brain when people engage in activity Z.” Instead, we want to understand that neuroimaging experiments reveal brain activation differences between activity Z and activity X.
The next critical component of neuroimaging design is that neuroimaging experiments must be designed for repeated activations. In order to be able to identify the differences between two conditions we must be able to flip back and forth between the two conditions multiple times. Ideally, we’d like to flip back and forth every 20 seconds from condition one to condition two. And, we would like to do this for an extended period of time, say, for example, eight or nine minutes. This repeated activation is important for our ultimate results. The data that we get from neuroimaging is noisy, both because there is a great deal of an uninteresting activity in the brain itself, and because of noise generated by the neuroimaging process. In order to deal with this noise. We need to have a large number of repetitions of an activity. By repeating an activity again and again and again, we can learn which parts of the image are truly related to the activity and which parts are simply unrelated noise.
This also deals with a common misunderstanding of the neuroimaging process. Some people may look at the results of a neuroimaging experiments and believe that they may just as easily be reflecting the random daydreaming that subjects engaged in while lying in the scanner. The reason why we are reasonably confident that this is not the case is because of the analysis of so many repetitions across so many participants. For example, if a participant was thinking about what he or she was going to have for lunch instead of the question on the screen in front of him or her, it is unlikely that he or she would be thinking about lunch during each of the 40 times that the experimental condition was present, and somehow, not be thinking about lunch during each of the 40 times that the comparison condition was present. In this way, the large number of repetitions helps to filter out the noise or random thoughts that are common in our cognitive processes.
Additionally, we are able to filter out noise by comparing the activations of several different participants. Just because one participant may have been daydreaming during parts of the experiment does not pose a problem, because it is highly unlikely that the other participants were daydreaming about the same things at the same times. Thus, we are not too concerned about the effects of random noise or random thought, because the analysis focuses on those neural activations that were common across all repetitions of the particular condition and were common across all participants who were exposed to the same condition. Thus, random thoughts would only be a problem if they simultaneously occurred among most or all of the participants and additionally occurred during the experimental condition but not during the comparison condition.
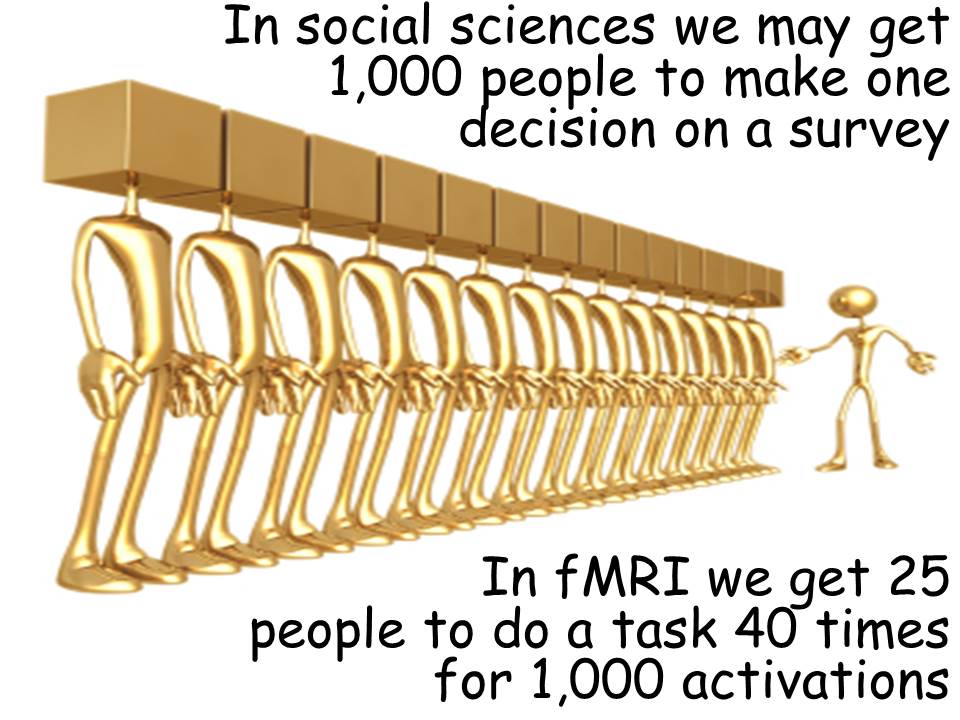
This brings us to another distinction of neuroimaging research. In most social science research, we gain confidence in our results largely by increasing the number of people participating in our survey. (This is, in fact, the type of research I have been engaged in for many years, also looking at the topic of charitable bequest planning, but from a very different methodological perspective.)
However, in neuroimaging we get to a large number of observations, not by having a massive number of people scanned in the fMRI machine, but instead by having a relatively small number of people scanned who are engaging in the task of interest a large number of times. We may actually get to a similarly large number of observations in neuroimaging, but we do so with a much smaller number of participants.
Thus, it is not uncommon to see neuroimaging studies with between 12 and 35 participants. To the extent that we are interested in neural correlates that are universally shared across all humans, such a small sample is completely appropriate. However, as with all research, there is always the risk of obtaining an unusual sample that is completely distinctive from the population in general in the key characteristics of interest. Thus, as with most areas of scientific inquiry we gain confidence in results only slowly and with repeated replications produced by a variety of different researchers. Unfortunately, as the results reported here come from the first experimental inquiries into charitable bequest planning, we do not yet have a large range of replications that would increase our confidence in the results. However, to the extent that these results also correspond with findings from completely different methodologies of inquiry, we may begin to feel a bit more confident in the results as we await future replications and extensions.